Bitcoin Price Holds Above $37,000 And Widens Its Range

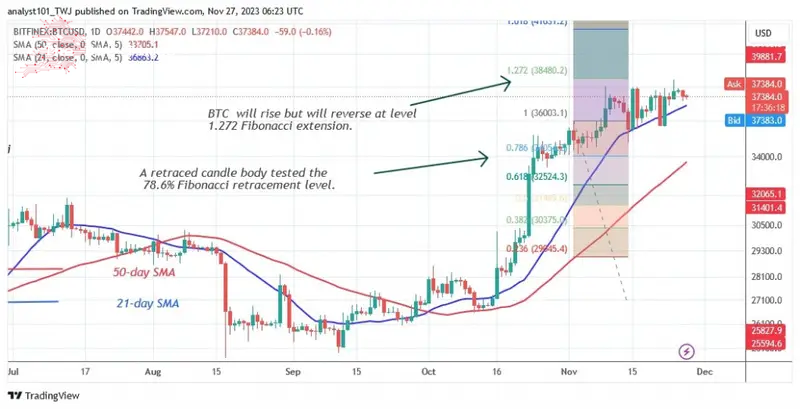
The price of Bitcoin (BTC) has remained stable above the moving average lines. The largest cryptocurrency is currently on the retreat after being rejected on November 24.
Bitcoin (BTC) Price Long Term Prediction: Bullish
Resistance at $38,000 has slowed the upward momentum of the Bitcoin price. However, the market reached a high of $38,437 before retreating. The cryptocurrency has returned to its previous trading range of $35,400 to $38,000. In other words, at the time of writing, the BTC price is worth $37,211. On the downside, the decline is approaching the 21-day SMA.
Bitcoin risks a decline if the bears break below the 21-day SMA and the downtrend continues. The decline will extend to a low above the 50-day SMA or the $34,000 support.
However, if Bitcoin finds support above the moving average lines, the existing price range will be maintained.
Bitcoin indicator reading
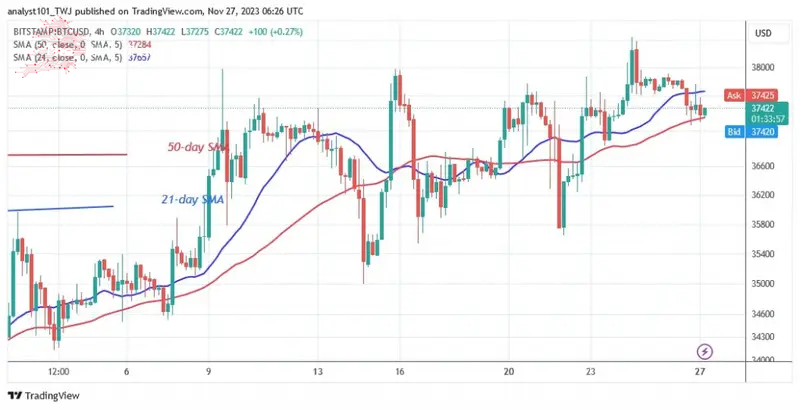
The 21-day SMA has been repeatedly tested by BTC prices and provides support for the current rally. The cryptocurrency will continue to rise as long as the moving average line is not breached. The price of the cryptocurrency is expected to remain in a trading range as long as it moves between the moving average lines on the 4-hour chart.
Technical indicators:
Key resistance levels – $30,000 and $35,000
Key support levels – $20,000 and $15,000

What is the next direction for BTC/USD?
Bitcoin will move within its trading range as long as it stays above the moving average lines. The recent pullback has stopped as it consolidates above the $37,000 support. It is the doji candlesticks that have limited the price movement.
Coinidol.com reported previously that Bitcoin has been in a downtrend since November 9. After four setbacks, buyers have not managed to hold the price above the current high of $38,000.

Disclaimer. This Analysis and forecast are the personal opinions of the author and are not a recommendation to buy or sell cryptocurrency and should not be viewed as an endorsement by CoinIdol.com. Readers should do their research before investing in funds.
Comments
Post a Comment