Bitcoin forms first ever weekly Golden Cross; What it means for BTC price?
After a sudden dip that retraced the Bitcoin (BTC) price, this flagship crypto is slowly recuperating, and one pattern can be a sign of bullish things to come.
BTC has recently experienced a significant event in the trading realm known as the “Golden Cross.” This occurrence marks the first time this bullish pattern has manifested on the weekly chart, as per X post from analytics platform Barchart on January 8.
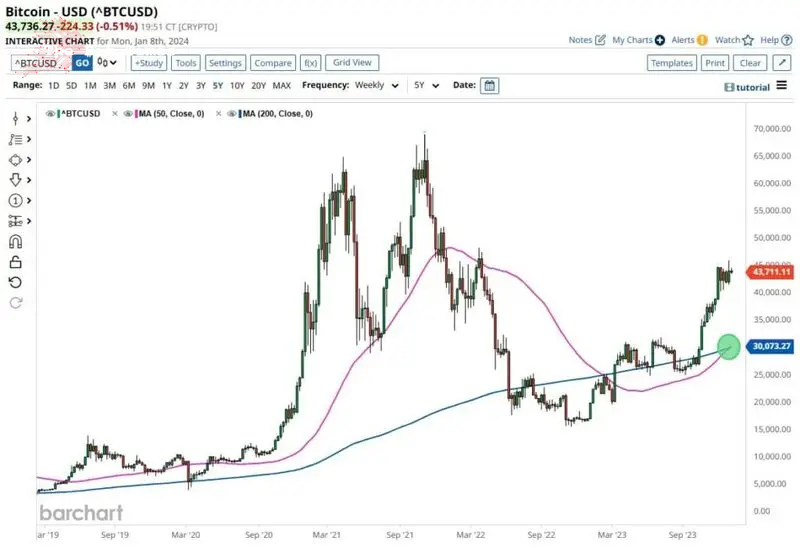
A golden cross is identified when an asset’s short-term moving average (MA) surpasses its long-term moving average, signaling positive market sentiment.
What can the Golden Cross mean for BTC?
The occurrence on this cryptocurrency’s weekly chart involves the 50-week moving average surpassing the 200-week MA. Traditionally, this pattern is interpreted as a positive signal, hinting at the potential for a sustained upward trend.

Honduran special economic zone adopts Bitcoin as unit of account

Plan to trade XRP? Here's what you should now

$76 billion asset manager to donate 5% of Bitcoin spot ETF profits to BTC development

Ethereum price prediction as mysterious whale bags $50 million of ETH in minutes

Machine learning algorithm sets Dogecoin price for January 31, 2024
Nonetheless, it’s crucial to recognize that the Golden Cross can function as a lagging indicator. When this cross occurs, the market might have already incorporated the bullish sentiment, indicating that the pattern confirms an existing trend rather than forecasting a new one.
Bitcoin price analysis
However, despite the formation of Golden Cross, the BTC price has experienced a downturn, losing approximately -0.34% of its value in the previous 24 hours.
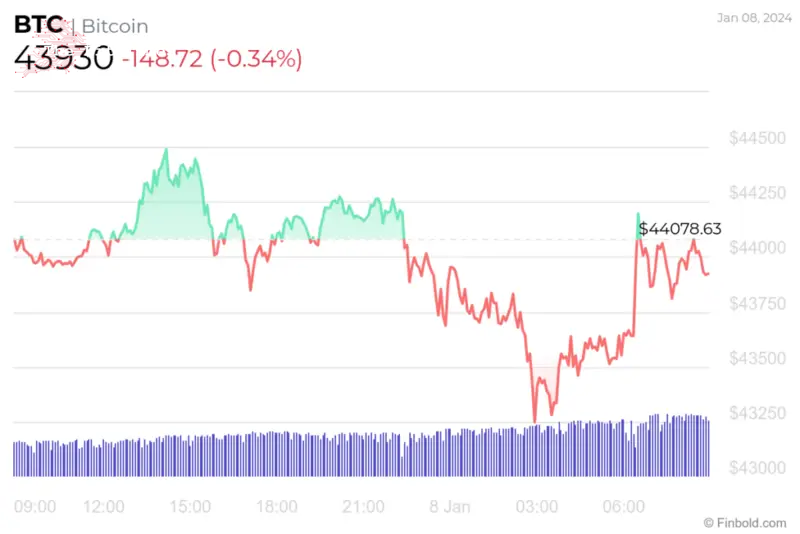
On the weekly chart, things seem more optimistic due to the addition of 3.43% while still losing -0.62% during the last 30 days, as per the latest data obtained on January 8.
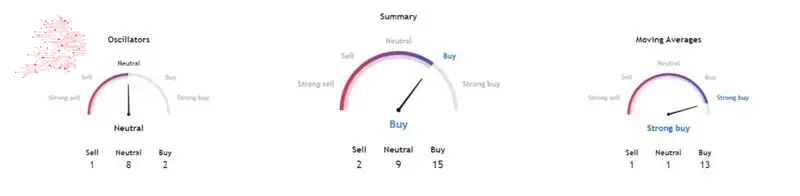
At the same time, the technical indicators indicate a prevailing sentiment labeled as ‘buy.’
An integrated evaluation of these indicators assigns a ‘buy’ rating at 15, with moving averages signaling a ‘strong buy’ at 13. Oscillators are tilting towards a ‘neutral’ rating, registering at 8.
Despite the formation of the weekly Golden Cross, it is essential to note that various sets of elements influence Bitcoin’s price.
Disclaimer: The content on this site should not be considered investment advice. Investing is speculative. When investing, your capital is at risk.


Comments
Post a Comment